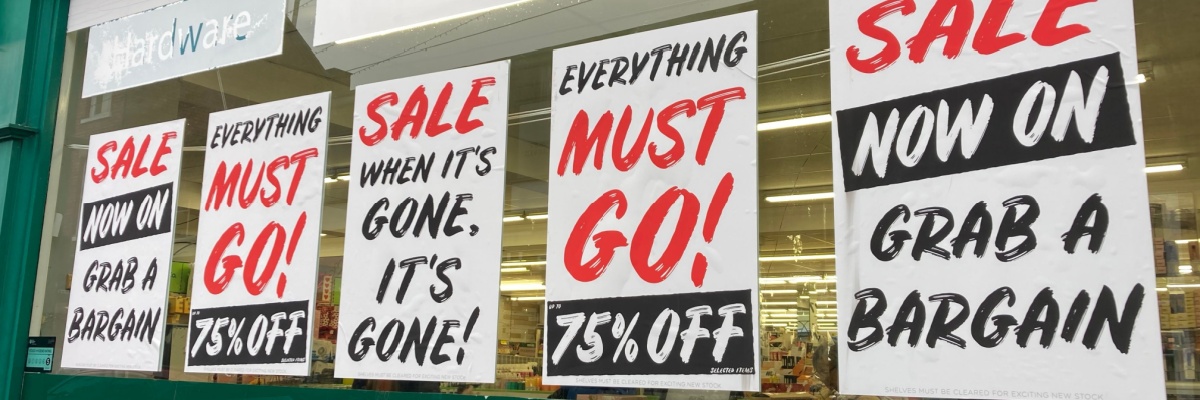
The end of financial year (EOFY) sales turbo-charged purchases in June, bringing total household spending for the month to $77 billion, a jump of 0.5% from May.
The data, released today from the latest ABS Monthly Household Spending Indicator (MHSI), saw the largest monthly increases, in seasonally adjusted terms, recorded in the categories of furnishings and household equipment (+2.0%), food (+1.5%) and recreation and culture (+1.0%).
These results are no surprise, with Canstar Blue survey data showing 33% of Aussies wait for EOFY sales events to purchase big-ticket items such as appliances, furniture and devices.
How did households spend in June?
The household spending figures for the month of June echoed the EOFY sales period, with the category of furniture and household equipment recording the largest increase for the month, in dollar terms.
Compared to the same time last year, recreation and culture recorded the largest increase, in both percentage and dollar terms, with an increase of $971.1 million, and a percentage jump of 7.9%.
Only three categories recorded a drop for the month: alcoholic beverages and tobacco (-2.4%), hotels, cafes and restaurants (-0.8%) and health (-0.3%)
← Mobile/tablet users, scroll sideways to view full table →
| Monthly Household Spending Indicator: June 2025 |
|||
|---|---|---|---|
| Category | Jun-25 | Change month-on-month | Change year-on-year |
| Total | $77.0 billion | +$370.0 million
+0.5% |
+$3.5 billion
+4.8% |
| Food | $12.3 billion | +$184.5 million
+1.5% |
+$856.9 million
+7.5% |
| Alcoholic beverages and tobacco | $2.9 billion | -$73.0 million
-2.4% |
-$586.4 million
-16.5% |
| Clothing and footwear | $4.4 billion | +$66.7 billion
+1.6% |
+$190.6 million
+4.6% |
| Furnishings and household equipment | $5.5 billion | +$110.2 million
+2.0% |
+250.4 million
+4.8% |
| Health | $8.9 billion | -$22.8 million
-0.3% |
+$603.0 million
+7.2% |
| Transport | $12.7 billion | +$6.9 million
+0.1% |
+$268.9 million
+2.2% |
| Recreation and culture | $13.3 billion | +$137.8 million
+1.0% |
+$971.1 million
+7.9% |
| Hotels, cafes and restaurants | $9.6 billion | -$81.3 million
-0.8% |
+$517.8 million
+5.7% |
| Miscellaneous goods and services | $7.3 billion | +$41.0 million
+0.6% |
+$477.0 million
+7.0% |
Source: ABS Monthly Household Spending Indicator, June 25, seasonally adjusted data.
What does research from Canstar Blue reveal about Australians’ spending habits?
More than half (60%) of Australians surveyed by Canstar Blue said they believe EOFY sales are a good opportunity to buy something they want at a discount.
Some are committed to ensuring they get the best bargain, with 12% saying they sign up to retailer newsletters and follow social media pages to make sure they’re getting the best deal.
When it comes to how Aussies chose to buy during these sales, just under half (45%) looked at products online before going in-store to purchase items, 39% shopped online only, and 15% only shopped in-store.
While plenty of shoppers would have secured their purchases on sale, our data shows the average spend on some appliances and devices is:
- Washing machine: $859
- Smartwatch or fitness tracker: $409
- Television: $1,314
- Coffee machine: $274
How did spending track across the states?
The Northern Territory recorded the highest increase, in percentage terms, for the month of June at 1.3%, with New South Wales close behind with a percentage increase of 1.1%, and the highest increase, in dollar terms, of $259.1 million.
← Mobile/tablet users, scroll sideways to view full table →
| Monthly Household Spending Indicator: June 2025, state |
|||
|---|---|---|---|
| State | Jun-25 | Change month-on-month | Change year-on-year |
| New South Wales | $24.4 billion | +$259.1 million
+1.1% |
+$1.1 billion
+4.7% |
| Victoria | $18.7 billion | +$27.7 million
+0.1% |
+$536.8 million
+3.0% |
| Queensland | $16.0 billion | +$74.8 million
+0.5% |
+$967.0 million
+6.4% |
| South Australia | $5.2 billion | +$7.7 million
+0.1% |
+$209.1 million
+4.2% |
| Western Australia | $8.9 billion | -$30.5 million
-0.3% |
+$595.1 million
+$7.2% |
| Tasmania | $1.6 billion | +$12.3 million
+0.8% |
+$51.5 million
+3.4% |
| Northern Territory | $0.8 billion | +$10.5 million
+1.3% |
+$55.5 million
+7.2% |
| ACT | $1.4 billion | +$8.3 million
+0.6% |
+$44.6 million
+3.3% |
Source: ABS Monthly Household Spending Indicator, June 25, seasonally adjusted data.
Canstar Blue’s spokesperson, Eden Radford, says, “the bumper spend in June is no surprise, as households took advantage of the end of financial year sales to get the big ticket items they’d been holding out for at a discount.”
“Australians are becoming increasingly savvy when it comes to bagging a bargain. Canstar Blue data shows almost half of shoppers said they looked at products online first, in a positive sign they spent their time comparing prices before hitting the stores to secure the best offer.
“While the next big sales season may seem far away, there’s little doubt it will be just a couple of months before we’re fast reminded about the upcoming Black Friday and Cyber Monday sales.
“For any households who feel like they missed out, or are eyeing some kind of shiny new device or appliance, do your best to ignore the FOMO and wait it out. A few extra weeks on a wishlist could save you plenty more in the long run.”


Share this article