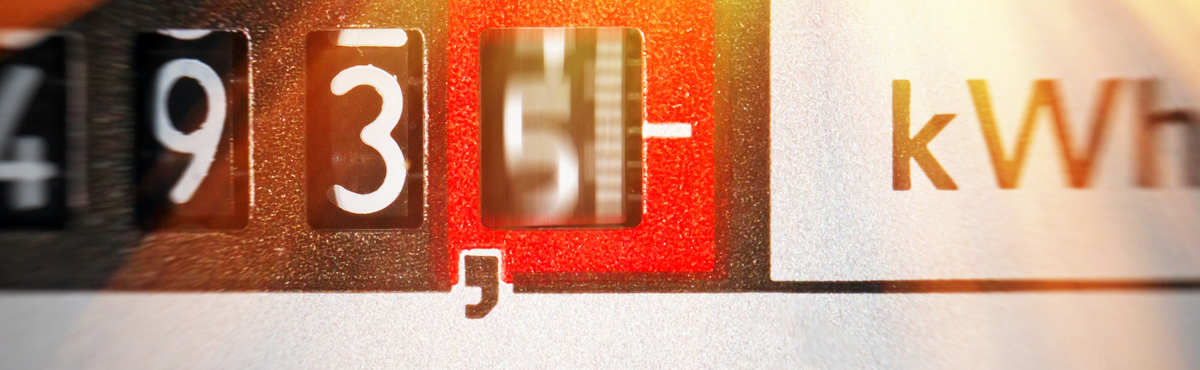

You may have noticed on your power bill that you are charged per ‘kWh’ for electricity – but what does that even mean? It can be pretty tricky to wrap your head around some of the energy jargon out there, but taking the time to learn will help you understand your bill and equip yourself with the knowledge to shop around for the best deal on the market.
On this page:
What does ‘kWh’ stand for?
A kWh stands for ‘KiloWatt Hour’, which is a unit of energy that measures how much electricity your home has used. ‘Kilo’ means 1,000, ‘watt’ is a measure of power and ‘h’ stands for hour. Appliances are often described in terms of their wattage, that is, the power they require to run. If you run a 1,000 watt (1kW) appliance for one hour, then that will use one kWh. If you run a 5kW air conditioner for one hour, then that would use 5kWh of electricity. One 100 watt light bulb, on the other hand, would take 10 hours to use one kWh.
Your home’s electricity usage (in kWh) is recorded by your electricity meter and passed on to your retailer for billing. Your bill will detail how many kWhs were used according to the meter, however, your energy company may have to estimate your usage if your meter was inaccessible. For some perspective, the average five-person household consumes roughly 20kWh of electricity per day.
What’s the difference between a kW and kWh?
It’s common for people to confuse kW and kWh. The difference is that kW is a measurement of power, while a kWh is a measurement of energy. That might sound nit-picky, but it’s an important distinction.
For example, a 4kW solar panel system has a maximum power output of 4kW. If that output was sustained over an hour, then the solar system will produce 4kWh of electricity. If it maintains that output for four hours, then that system will produce 16kWh. If you are considering solar and wanted it to cover half of your home’s electricity usage (say, 10kWh), then you don’t need a 10kW solar system, rather, you should only need a 2-3kW system – subject to the weather. Another way to think about this is to think of kW as speed and kWh as distance. The higher the speed (kW), the greater the distance you will cover (kWh).
Average electricity prices per kWh
Customers are charged for electricity per kilowatt hour of electricity they use – this is referred to as a ‘usage charge’. Usage charges vary considerably from state to state and can vary anywhere from 25c/kWh to 45c/kWh. Below, Canstar Blue has calculated the average usage rate per kWh for single-rate tariffs across each distribution network in NSW, VIC, south-east Queensland, South Australia, the Australian Capital Territory and Tasmania. Prices are shown in cents per kWh.
| State | Distribution Network | Average Electricity Usage Rate (per kWh) |
|---|---|---|
| NSW | Ausgrid | 35.7c/kWh |
| NSW | Endeavour Energy | 37.2c/kWh |
| NSW | Essential Energy | 38.9c/kWh |
| VIC | AusNet Services | 35.8c/kWh |
| VIC | Citipower | 26.7c/kWh |
| VIC | Jemena | 30.7c/kWh |
| VIC | Powercor | 30.4c/kWh |
| VIC | United Energy | 29.3c/kWh |
| QLD | Energex | 31.4c/kWh |
| SA | SA Power Networks | 45.3c/kWh |
| ACT | Evoenergy | 26.6c/kWh |
| TAS | TasNetworks | 29.5c/kWh |
Source: www.canstarblue.com.au – 09/10/2023. Average electricity usage rates based on non-solar only plans on Canstar’s database for each respective rate type (single rate and controlled load), available for annual usages based on the reference usage amounts for each distributor: NSW, VIC, QLD and SA per AER, VIC per Victorian Default Offer, ACT per ICRC, TAS per median usage in the Office of the Tasmanian Regulator’s report, Typical Electricity Customers in Tasmania 2022. In Queensland, the tariffs are more commonly referred to as tariff 11 (single rate), tariff 31 (controlled load 1), and tariff 33 (controlled load 2). In Tasmania, the tariffs are more commonly referred to as tariff 31 (single rate) and tariff 41 (controlled load).
You can read our article on electricity costs per kWh for more details. Keep in mind that you must pay ‘service’ or ‘supply’ charge in addition to usage charges. This is a daily fee for remaining connected to the power grid.
What do electricity costs per kWh look like over a year?
To help you get a feel for what typical kWh usage costs look like over the course of year, take a look at the following tables where we show some of the cheapest deals on our database for a selected postcode in each state. Use our comparison tool above for specific quotes in your area.
Here are some of the cheapest published deals from the retailers on our database that include a link to the retailer’s website for further details. These are products from referral partners†. These costs are based on the Ausgrid network in Sydney but prices may vary depending on your circumstances. This comparison assumes general energy usage of 3900kWh/year for a residential customer on a single rate tariff. Please use our comparison tool for a specific comparison in your area. Our database may not cover all deals in your area. As always, check all details of any plan directly with the retailer before making a purchase decision.
Here are some of the cheapest published deals from the retailers on our database that include a link to the retailer’s website for further details. These are products from referral partners†. These costs are based on the Citipower network in Melbourne but prices may vary depending on your circumstances. This comparison assumes general energy usage of 4000kWh/year for a residential customer on a single rate tariff. Please use our comparison tool for a specific comparison in your area. Our database may not cover all deals in your area. As always, check all details of any plan directly with the retailer before making a purchase decision.
Here are some of the cheapest published deals from the retailers on our database that include a link to the retailer’s website for further details. These are products from referral partners†. These costs are based on the Energex network in Brisbane but prices may vary depending on your circumstances. This comparison assumes general energy usage of 4600kWh/year for a residential customer on a single rate tariff. Please use our comparison tool for a specific comparison in your area. Our database may not cover all deals in your area. As always, check all details of any plan directly with the retailer before making a purchase decision.
Here are some of the cheapest published deals from the retailers on our database that include a link to the retailer’s website for further details. These are products from referral partners†. These costs are based on the SA Power network in Adelaide but prices may vary depending on your circumstances. This comparison assumes general energy usage of 4000kWh/year for a residential customer on a single rate tariff. Please use our comparison tool for a specific comparison in your area. Our database may not cover all deals in your area. As always, check all details of any plan directly with the retailer before making a purchase decision.
Kilowatt hours and understanding your power bill
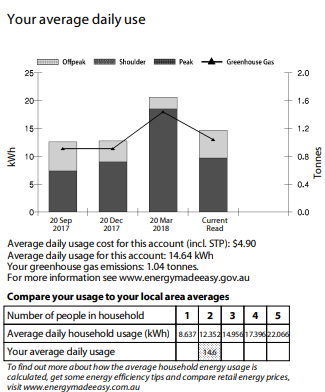
Your power bill includes a lot of useful information that you should be able to understand now that you have your head around kWhs. Power bills will often include a diagram like the one shown below. The left axis of the graph illustrates how much electricity (in kWh) has been used over the past few billing quarters, while the right axis shows how much greenhouse gas was consequently produced. You may notice that the graph refers to off-peak, shoulder and peak usage. If you’re looking to learn more about these, check out our guide on peak and off peak electricity times.
The table below the graph illustrates the household’s average daily energy usage in kWhs and compares this to the expected average usage of various household sizes in the local area. This is a great way to tell if you’re using more energy than you need to.
The second page of your bill should include a technical breakdown of your charges (pictured below). Here you can see a ‘usage kWh’ column which represents how much electricity has been used. Note that the ‘CL2’ row refers to a controlled load tariff while the ‘Total Anytime’ row is just standard usage on a single rate tariff. Notice that on this bill, the household has paid $313 for electricity usage ($93 for CL2 +$220 for Total Anytime). However, the home is also charged GST and a service charge.
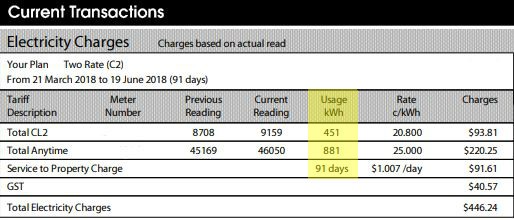
The ‘previous reading’ and the ‘current reading’ columns indicate the kWh figure displayed on your electricity meter at your latest reading compared to the previous one. The difference in kWh between these two figures is what’s used to calculate how many kWhs of electricity you have used and what you owe the power company (highlighted in yellow).
Why it’s important to understand kilowatt hours
Energy literacy is the key to finding the best deal on electricity. Now that you understand kWhs, you should check your bills regularly to see how your electricity usage stacks up and whether there are savings to made by reducing your power usage, finding a better deal, or both.
When shopping around, it’s important to compare the electricity usage charges per kWh, as well as service charges and any possible discounts. Fortunately, Canstar Blue has made comparing electricity products and providers simple. Get started via the link below.

Share this article